![]()
Météo Solaire
Le soleil en temps réel
|
![[Solar Dynamics Observatory (SDO) Atmospheric Imaging Assembly (AIA) image at 94 Å]](http://umbra.nascom.nasa.gov/images/latest_aia_94.gif "False color image of the Sun in Fe XVIII 94 Å")
![[Solar Dynamics Observatory (SDO) Atmospheric Imaging Assembly (AIA) image at 131 Å]](http://umbra.nascom.nasa.gov/images/latest_aia_131.gif "False color image of the Sun in Fe XX 131 Å")
![[Solar Dynamics Observatory (SDO) Atmospheric Imaging Assembly (AIA) image at 171 Å]](http://umbra.nascom.nasa.gov/images/latest_aia_171.gif "False color image of the Sun in Fe IX, X 171 Å")
![[Solar Dynamics Observatory (SDO) Atmospheric Imaging Assembly (AIA) image at 193 Å]](http://umbra.nascom.nasa.gov/images/latest_aia_193.gif "False color image of the Sun in Fe XII 193 Å")
![[Solar Dynamics Observatory (SDO) Atmospheric Imaging Assembly (AIA) image at 211 Å]](http://umbra.nascom.nasa.gov/images/latest_aia_211.gif "False color image of the Sun in Fe XIV 211 Å")
![[Solar Dynamics Observatory (SDO) Atmospheric Imaging Assembly (AIA) image at 304 Ã… Å]](http://umbra.nascom.nasa.gov/images/latest_aia_304.gif "False color image of the Sun in He II 304 Ã… Å")
![[Solar Dynamics Observatory (SDO) Atmospheric Imaging Assembly (AIA) image at 335 Å]](http://umbra.nascom.nasa.gov/images/latest_aia_335_tn.gif "False color image of the Sun in Fe XVI 335 Å")
![[Solar Dynamics Observatory (SDO) Atmospheric Imaging Assembly (AIA) image at 1600 Å]](http://umbra.nascom.nasa.gov/images/latest_aia_1600.gif "False color image of the Sun in C IV and continuum around 1600 Å")
![[Solar Dynamics Observatory (SDO) Atmospheric Imaging Assembly (AIA) image at 1700 Å]](http://umbra.nascom.nasa.gov/images/latest_aia_1700.gif "False color image of the Sun in continuum around 1700 Å")
![[Solar Dynamics Observatory (SDO) Atmospheric Imaging Assembly (AIA) image at 4500 Å]](http://umbra.nascom.nasa.gov/images/latest_aia_4500.gif "False color image of the Sun in continuum around 4500 Å")
![[Solar Dynamics Observatory (SDO) Heliospheric and Magnetic Imager (HMI) magnetogram]](http://umbra.nascom.nasa.gov/images/latest_hmi_mgram.gif "False color solar photospheric magnetogram")
![[Solar Dynamics Observatory (SDO) Heliospheric and Magnetic Imager (HMI) continuum intensity image at 6173 Å]](http://umbra.nascom.nasa.gov/images/latest_hmi_igram.gif "False color solar photospheric magnetogram")
![[Hinode X-Ray Telescope (XRT) image in the titanium-polyimide filter]](http://umbra.nascom.nasa.gov/images/latest_xrt.gif "False color image of the Sun in soft X-rays")
![[National Solar Observatory (NSO) image at 10830 Å]](http://umbra.nascom.nasa.gov/images/latest_solisHe_thumbnail.gif "False color image of the Sun in He I 10830 Å")
![[National Solar Observatory (NSO) SOLIS transverse magnetogram at 8542 Å]](http://umbra.nascom.nasa.gov/images/latest_solisCh_thumbnail.gif "False color image of the solar transverse magnetic fields in Ca II 8542 Å")
![[National Solar Observatory (NSO) SOLIS transverse magnetogram at 8542 Å]](http://umbra.nascom.nasa.gov/images/latest_K_line_thumbnail.gif "False color image of the solar transverse magnetic fields in Ca II 8542 Å")
![[National Solar Observatory (NSO) SOLIS transverse magnetogram at 8542 Å]](http://umbra.nascom.nasa.gov/images/latest_mk4_thumbnail.gif "False color image of the solar transverse magnetic fields in Ca II 8542 Å")
|
 |
NOAA / Space Weather Prediction Center
 |
 |
 |
 |
| GONG Intensity Photosphere  |
GONG Magnetic Photosphere  |
GONG Farside Activity Photospheric  |
| GONG H-Alpha Image  |
SOLIS Equivalent Width Chromosphere  |
SOLIS Longitudinal Mag Wing Chromosphere  |
| SOLIS Longitudinal Mag Photosphere  |
SOLIS Vector Mag Photosphere  |
SOLIS Longitudinal Mag Chromosphere  |
| AFRL-NSO/SP FE XIV Corona  |
AFRL-NSO/SP Fe X Corona  |
AFRL-NSO/SP Composite Corona  |

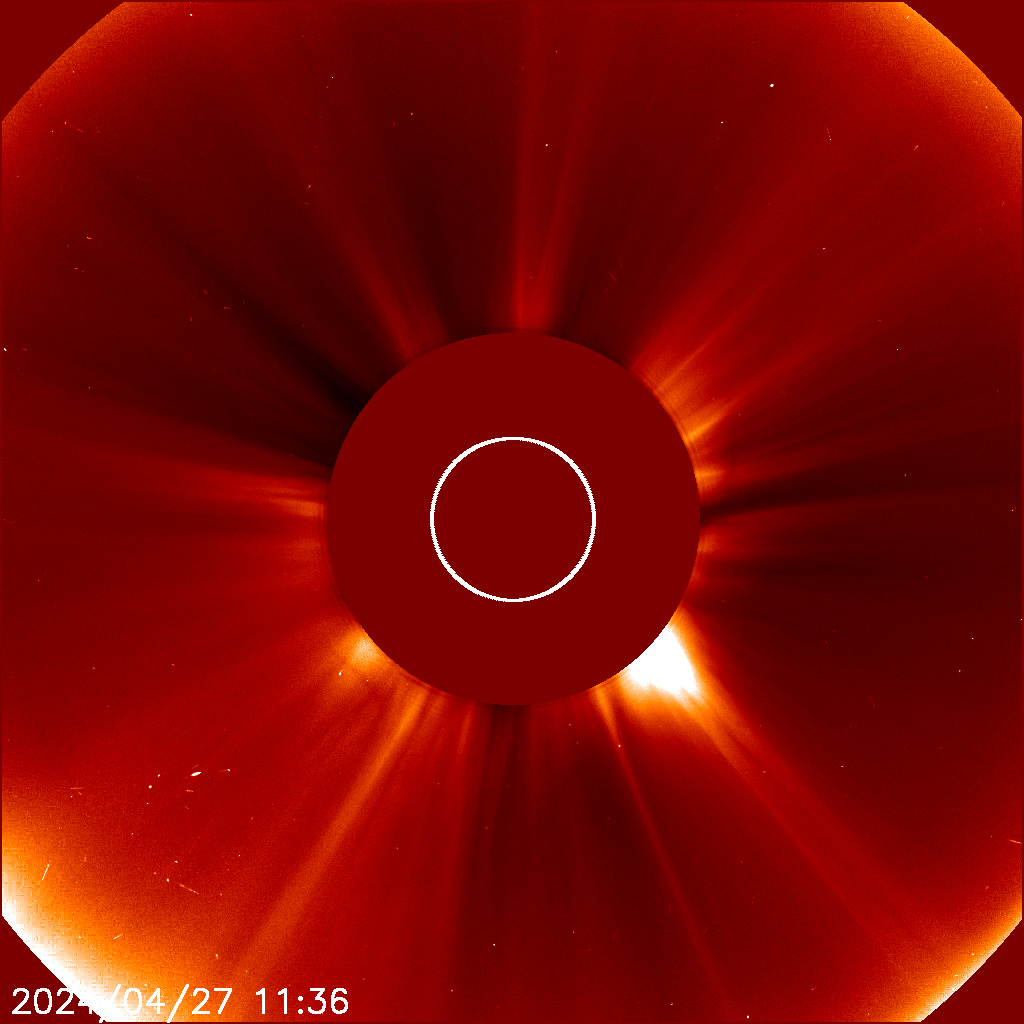
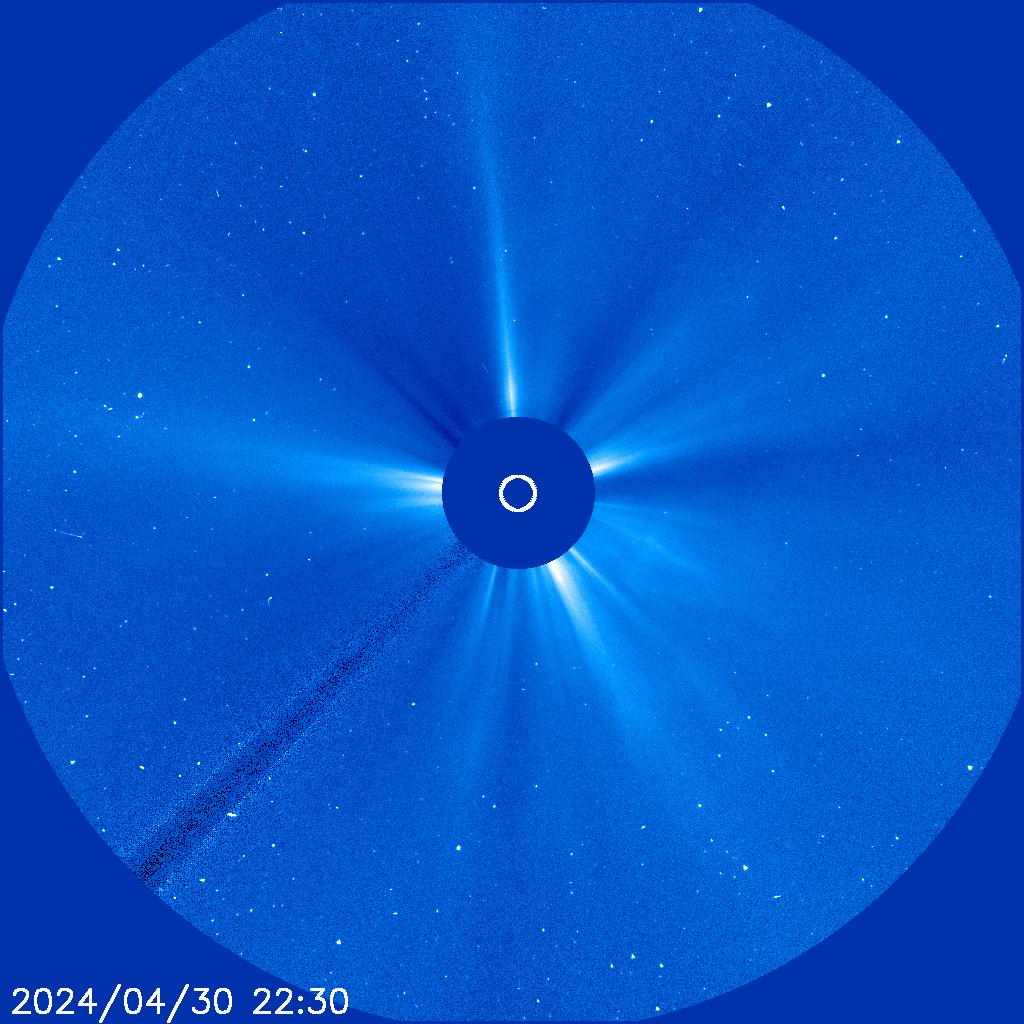
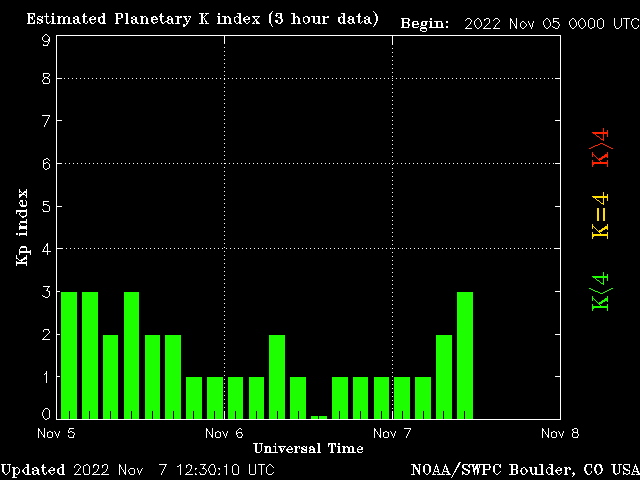
source : NOAA Space Weather Prediction Center

source : NOAA Space Weather Prediction Center

source : NOAA Space Weather Prediction Center

source : IPS Radio and Space Services (gouvernement Australien)
Atmospheric imaging assembly, the Sun to day
http://sdowww.lmsal.com/suntoday/
Prévisions d'évolution des vents solaires
http://www.swpc.noaa.gov/products/wsa-enlil-solar-wind-prediction
source : NOAA Space Weather Prediction Center

source : NOAA Space Weather Prediction Center

source : OVATION, modèle mis au point par NOAA Space Weather Prediction Center
Top Top